
Associate Professor, Civil & Environmental Engineering,
Birla Institute of Technology, Mesra, Ranchi, India
Polypropylene reinforcement is a common method of strengthening soil. The aim of the present study is to understand the behavior of randomly distributed discrete polypropylene reinforced cohesive soil subjected to different strain rates. Unconsolidated undrained triaxial tests were conducted with 5 different polypropylene contents (0, 0.1, 0.2, 0.3 and 0.4 % by dry weight of soil) at 4 different strain rates (0.5, 1, 3 and 6 %/minute). For unreinforced soils, the failure deviator stress initially increased, then either decreased or remained constant with increase in strain rate. But for reinforced soil, the stress values showed an increasing trend with rise in strain rate. It was found that for reinforced soils, the failure deviator stress was minimum and maximum corresponding to 0.5 and 6 %/minute strain rates respectively. With increase in rate of strain, the value of cohesion initially increased and then decreased beyond an optimum value of reinforcement for most of the cases. The value of angle of internal friction did not show any specific trend corresponding to the change in strain rates.
Introduction
Reinforcing a soil mass is an efficient and proven technique to improve its engineering properties. The principal aim of incorporating reinforcement in soil is to improve the bearing capacity and stability, and to decrease the deformations and settlements. Polymer such as polypropylene (PP) reinforcement in the form of discrete fiber is a popular and well established method of soil reinforcement. PP fibers are used to increase shear strength, to minimize volumetric shrinkage and swelling of soil. The preponderance of published research work is about the effect of randomly distributed fibers on enhancing the properties of cohesionless soils [1-7]. Some of the noteworthy investigations on the strength behavior of fiber reinforced fine grained soils are by Freitag [8], Nataraj and McManis [9], Puppala and Musenda [10], Tang et al. [11]. Zaimoglu and Yetimoglu [12] investigated the behavior of polypropylene reinforced fine grained soil and reported that the unconfined compression strength tended to increase when the fiber content was increased. Masoumi et al. [13] carried out improvement of soft soil with both polypropylene fiber and polyvinyl acetate resin. Sharma [14] used waste polypropylene fiber and cement kiln dust to improve strength of clayey soil. It was found that upon addition of fibers, unconfined compressive strength and California bearing ratio increased appreciably.
One of the most important factors controlling the strength of soil is the strain rate to which the soil is subjected [15-18]. The responses of the soil get affected if the loading time/ strain rate changes. Previously, investigations had been performed to observe the influences of strain rate on effective stress parameters [19], undrained strength [20], and stiffness [21] of soils. Building up of pore pressure at low strain rate (and constant moisture content) was opined to be a crucial parameter for strength reduction [17]. Abraham et al. [22] observed the influence of strain rate on the strength parameters of clay. It was found that there was a rise in undrained strength as the strain rate increased in triaxial tests. Martindale et al. [23] investigated the response of a strain rate dependent clay constitutive model with parametric sensitivity and uncertainty quantification. Alam et al. [24] investigated the behavior of sandstone under different strain rates in uniaxial loading. The failure strain and the modulus of elasticity increased with increase in strain rate. Enomoto et al. [25] conducted a series of drained triaxial compression tests to evaluate the rate-dependent stress-strain behavior of gravelly soils.
Till now few studies have been conducted to observe the behavior of polymer reinforced soil at different strain rates. But, in practical cases, there may be variations in the time during which the load is applied or there may be variations in strain rates; hence the strength and deformation characteristics/ behavior of the soil-fiber matrix will be affected. The principal objectives of this study are to investigate the effect of strain rate on strength of cohesive soil reinforced with randomly distributed discrete polypropylene fibers and to establish the correlation between strain rate, polymer content, deviator stress, cohesion and angle of internal friction.
Experimental Investigations
Table 1 Properties of soil
| Property | Value |
| Specific gravity | 2.28 |
| Liquid limit (%) | 41.40 |
| Plastic limit (%) | 26.25 |
| Plasticity index (%) | 15.15 |
| Maximum dry density (kg m-3) | 1680 |
| Optimum moisture content (%) | 18.25 |
| Clay (%)* | 28 |
| Silt (%)* | 57 |
| Sand (%)* USCS [26] classification | 15 ML |
| IS:1498-1970 (Reaffirmed 2007) [27] classification | MI |
* As per IS: 1498 – 1970 (Reaffirmed 2007) [27]
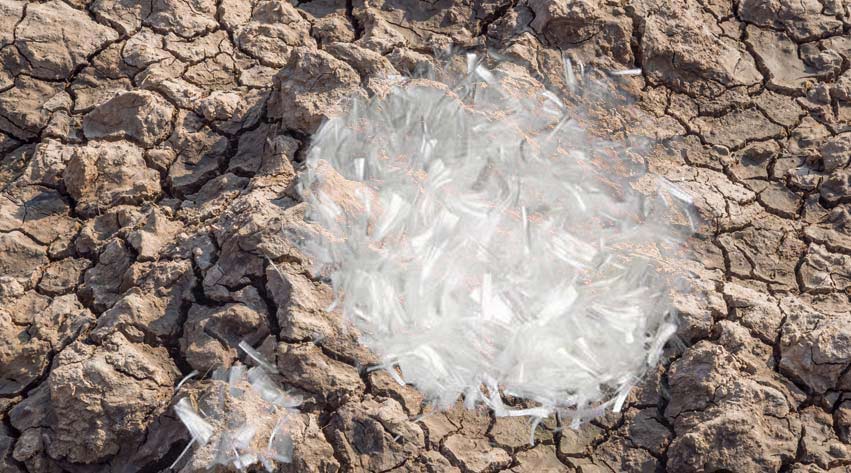
The soil sample was collected locally from Mesra, Ranchi, Jharkhand in India. Soil lumps were broken into small pieces and was screened through a sieve of 4.75 mm aperture to segregate the soil from pebbles, roots etc. The properties of soil are enlisted in Table 1. The soil was classified as “ML” and “MI” according to USCS [26] and IS: 1498-1970 (Reaffirmed 2007) [27] respectively. Polypropylene fibers of 0.05 mm thickness, 2.5 mm width were collected from local market and cut to 5 mm length and were used as reinforcement. The properties of polypropylene are presented in Table 2.
Table 2 Properties of polypropylene
| Property | Value |
| Young’s modulus (MPa) | 2539.073 |
| Stress at maximum load (MPa) | 134.468 |
| Strain at maximum load (%) | 787.083 |
| Stress at upper yield (MPa) | 86.193 |
| Strain at upper yield (%) | 12.083 |
The soil was mixed with the randomly distributed discrete polymer fiber in different proportions (0, 0.1, 0.2, 0.3, and 0.4 %) and Standard Proctor tests were conducted to determine the maximum dry densities and optimum moisture contents. The results are shown in Table 3. These showed that with increase in percentage of reinforcement, both maximum dry density as well as the optimum moisture content decreased. The fall in dry density may be attributed to the reduction of average unit weight of solids [28] i.e. mixture of soil and fiber with increase in fiber content. Also, the reduction in optimum moisture content might have happened due to drop in water absorption capacity of the soil-fiber matrix with increase in quantity of fiber.
Table 3 Standard proctor test results
| PP fiber content (%) | Maximum dry density (kg m-3) | Optimum moisture content (%) |
| 0.0 | 1680 | 18.25 |
| 0.1 | 1650 | 18.02 |
| 0.2 | 1610 | 17.68 |
| 0.3 | 1560 | 17.30 |
| 0.4 | 1520 | 16.95 |
Soil samples for triaxial tests were prepared by initial dry mixing of oven dried soil and the corresponding quantity of randomly distributed discrete fiber (0, 0.1, 0.2, 0.3, and 0.4 % by weight of oven dried soil). Then water was added to the mix according to the optimum moisture content as per the results obtained from standard proctor test. Unconsolidated undrained triaxial tests were conducted with samples having 38 mm diameter and 76 mm height at cell pressures (σ3) of 70, 140, 210 kPa to get the values of cohesion and angle of internal friction of reinforced and unreinforced soil.
Behavior of soil (reinforced and unreinforced) at four different strain rates of 0.5, 1, 3, and 6 %/minute were observed. As per “ASTM D 2850 – 95 (Reapproved 1999) – Standard test method for UU triaxial compression test on cohesive soils” [29], strain rates of approximately 1 %/minute and 0.3 %/minute may be used for plastic soil and brittle soil (such as soil with very low water content) respectively. In the current investigation, though the soil specimen was not brittle, still experiments were conducted under 0.5 %/minute strain rate to have an idea of the behavior of the soil at such low rate. High strain rates such as 5 %/minute are used to evaluate the response of soil under various field conditions for example fast installation process of pile and projectile penetration, rapid application of surcharge, rapid excavation, aircraft wheel loading on runways etc. [Sudan and Sachan (2017)].
The deviator stress –strain responses, variation in cohesion and angle of internal friction for different polypropylene proportions and strain rates were observed. In all experiments, failure deviator stress was considered as the stress corresponding to an axial strain of 15 % as per “ASTM D 2850 – 95 (Reapproved 1999) – Standard test method for UU triaxial compression test on cohesive soils” [29], or corresponding to physical failure of the sample, whichever occurred earlier.
Results and Discussions
Characteristics of Stress-Strain Curves and Variation in Failure Deviator Stress
Typical plots of deviator stress-axial strain for unreinforced soil are shown in Figure 1. It was found that the failure deviator stress corresponding to 0.5 % /minute strain rate was least. As the strain rate increased from 0.5 to 1 % /minute, the stress values (corresponding to a particular magnitude of axial strain) also increased. In experiments

performed at a slower rate of strain, comparatively more time had been permitted for structural breakdown, hence a higher pore pressure at failure was generated leading to decreased strength. Again, on increasing the rate of strain from 1 to 3 %/minute, deviator stress decreased in general, or almost remained equal (to stresses corresponding to 1 %/ minute); this probably happened due to disintegration of the inter particle bond at higher strain rate. On increasing the strain rate from 3 to 6 %/minute, the stresses went down further. For axial strain up to about 8 %, the stresses were even below than those corresponding to 0.5 %/minute strain rate. This was also caused due to breakage of inter particle bond at elevated rate of testing. To summarize the above behavior, it may be said that the magnitude of the stress depends on the combined effects of generation of excess pore pressure at lower strain rate, as well as on disintegration of particle bonds at higher rate of strain.
For reinforced soils, irrespective of polypropylene percentage, the failure deviator stress was minimum and maximum corresponding to 0.5 %//minute and 6 %/minute strain rates respectively. Typical plots for above are shown in Figure 2. In this case, breaking of inter particle bond at higher strain rate was outdone by the strength induced by the fibers. Also, in majority of the experiments conducted with polypropylene reinforced soil no definite peak of stress was reached even at 15 % axial strain. This could be a manifestation of the ductile behavior induced by the fiber inclusions.

The percentage increase in deviator stress with reference to 0.5 %/minute strain rate (corresponding to the same cell pressure) are shown in Table 4 (a) to Table 4(e). It may be seen from Table 4 (a) that for soil without reinforcement and cell pressure (σ3)= 70 kPa, the increase in deviator stress corresponding to 1, 3, and 6 %/minute strain rate were almost same and above 90 % in each case. The magnitude of rise of stress for σ3 = 210 kPa were comparatively less (around 10 to 20 %) corresponding to different rate of strain (1, 3, and 6 %/minute). The increase in deviator stress was highest (119.87 %) at cell pressure of 140 kPa (3 %/minute). Table 4 (b) indicates that for 0.1 % PP reinforcement, the deviator stress increment was as low as 6.72 % (σ3 = 210 kPa, 1 %/minute strain rate), and as high as 162.28 % (σ3 = 70 kPa, 6 %/minute strain rate). For 0.2 % PP and 3 %/minute strain rate, as it may be seen from Table 4 (c), with a two-fold increase in cell pressure from 70 to 140 kPa, the percentage rise of stress was also almost doubled i.e. from 40.58 % to 80.72 %. Table 4 (d) reveals that with 0.3 % PP and 1 %/minute rate of strain, for a three-fold rise in σ3 (70 to 210 kPa) the corresponding percentage increment magnitude of deviator stress enhanced about one-and-half times (from 31.93 % to 45.07 %). Table 4 (e) shows that with 0.4 % PP, the peak percentage increase in stress (64.37 %) occurred for 6 %/minute strain rate and σ3 = 210 kPa.
Table 4 (a) Percentage increase (for soil without reinforcement) in deviator stress (with reference to 0.5%/minute strain rate)
| No PP | |||
| Strain rate (%/minute) | Cell pressure (kPa) | Deviator stress (kPa) | Increase (%) in deviator stress as compared to 0.5 %/ minute strain rate (corresponding to same cell pressure) |
| 0.5 | 70 | 84.98 | – |
| 140 | 111.91 | – | |
| 210 | 212.18 | – | |
| 1 | 70 | 166.63 | 96.08 |
| 140 | 190.11 | 69.88 | |
| 210 | 245.84 | 15.86 | |
| 3 | 70 | 162.38 | 91.08 |
| 140 | 246.06 | 119.87 | |
| 210 | 256.57 | 20.92 | |
| 6 | 70 | 163.24 | 92.09 |
| 140 | 202.34 | 80.81 | |
| 210 | 232.60 | 9.62 |
Table 4 (b) Percentage increase (for soil with 0.1 % reinforcement) in deviator stress (with reference to 0.5%/minute strain rate)
| 0.1 % PP | |||
| Strain rate (%/minute) | Cell pressure (kPa) | Deviator stress (kPa) | Increase (%) in deviator stress as compared to 0.5 %/ minute strain rate (corresponding to same cell pressure) |
| 0.5 | 70 | 95.67 | – |
| 140 | 126.58 | – | |
| 210 | 156.04 | – | |
| 1 | 70 | 136.13 | 42.29 |
| 140 | 144.20 | 13.92 | |
| 210 | 166.52 | 6.72 | |
| 3 | 70 | 142.81 | 49.27 |
| 140 | 163.77 | 29.38 | |
| 210 | 196.48 | 25.92 | |
| 6 | 70 | 250.92 | 162.28 |
| 140 | 261.85 | 106.87 | |
| 210 | 312.46 | 100.24 |
Table 4 (c) Percentage increase (for soil with 0.2 % reinforcement) in deviator stress (with reference to 0.5 %/minute strain rate)
| 0.2 % PP | |||
| Strain rate (%/minute) | Cell pressure (kPa) | Deviator stress (kPa) | Increase (%) in deviator stress as compared to 0.5 %/ minute strain rate (corresponding to same cell pressure) |
| 0.5 | 70 | 135.21 | – |
| 140 | 162.07 | – | |
| 210 | 259.17 | – | |
| 1 | 70 | 187.97 | 39.02 |
| 140 | 221.62 | 36.74 | |
| 210 | 305.24 | 17.78 | |
| 3 | 70 | 190.08 | 40.58 |
| 140 | 292.89 | 80.72 | |
| 210 | 329.60 | 27.18 | |
| 6 | 70 | 247.22 | 82.84 |
| 140 | 356.11 | 119.73 | |
| 210 | 388.87 | 50.04 |
Table 4 (d) Percentage increase (for soil with 0.3 % reinforcement) in deviator stress (with reference to 0.5%/minute strain rate)
| 0.3 % PP | |||
| Strain rate (%/minute) | Cell pressure (kPa) | Deviator stress (kPa) | Increase (%) in deviator stress as compared to 0.5 %/ minute strain rate (corresponding to same cell pressure) |
| 0.5 | 70 | 133.06 | – |
| 140 | 163.24 | – | |
| 210 | 175.46 | – | |
| 1 | 70 | 175.54 | 31.93 |
| 140 | 205.47 | 25.87 | |
| 210 | 254.54 | 45.07 | |
| 3 | 70 | 187.25 | 40.73 |
| 140 | 246.03 | 50.72 | |
| 210 | 310.18 | 76.78 | |
| 6 | 70 | 252.12 | 89.48 |
| 140 | 289.83 | 77.55 | |
| 210 | 425.75 | 142.65 |
Table 4 (e) Percentage increase (for soil with 0.4 % reinforcement) in deviator stress (with reference to 0.5 %/minute strain rate)
| 0.4 % PP | |||
| Strain rate (%/minute) | Cell pressure (kPa) | Deviator stress (kPa) | Increase (%) in deviator stress as compared to 0.5 %/ minute strain rate (corresponding to same cell pressure) |
| 0.5 | 70 | 124.23 | – |
| 140 | 172.53 | – | |
| 210 | 175.54 | – | |
| 1 | 70 | 158.72 | 27.76 |
| 140 | 190.90 | 10.65 | |
| 210 | 227.65 | 29.69 | |
| 3 | 70 | 158.94 | 27.94 |
| 140 | 201.76 | 16.94 | |
| 210 | 255.96 | 45.81 | |
| 6 | 70 | 170.52 | 37.26 |
| 140 | 223.43 | 29.50 | |
| 210 | 288.54 | 64.37 |
Effect of Strain Rate and Reinforcement on Cohesion
Figure 3 shows variation of cohesion with polypropylene contents at different strain rates. For unreinforced soil, in the present study the cohesion corresponding to 0.5 %/minute was much lower as compared to the value of the same for increased strain rates. This was associated with low value of deviator stress for 0.5 %/minute. Indeed, there may be a threshold value of rate of strain up to which the deviator stress / cohesion is considerably low. Further investigations are needed to throw more light on it. For unreinforced soil, corresponding to increase in strain rate from 1 to 3 %/minute, the cohesion remained almost same; and on increasing the rate from 3 to 6 %/minute the corresponding increase in cohesion was about 10 %. It could also be seen from Figure 3 that for strain rates of 0.5, 3, and 6 %/minute the value of cohesion initially increased and later reduced with increase in polymer content. It may be opined that there was an optimum value of fiber content corresponding to the maximum magnitude of cohesion, beyond which the cohesion reduced with increase in fiber proportion. The possible reasoning for above was that with greater fiber content, the mass of soil matrix became less than sufficient to develop a proper bond between soil and polymer causing inferior mixing and balling of fiber. Corresponding to strain rate of 1 %/minute the cohesion intercept varied with fiber content like a saw blade. Probably, the same might have happened due to uneven distribution of fibers when tests were done with higher quantity of reinforcing polymer.

Effect of Strain Rate and Reinforcement on Angle of Internal Friction
The variation of angle of internal friction did not show any particular pattern (Figure 4). At strain rate of 1 %/minute it showed a zig-zag type variation which was similar to the behavior asobserved by Zaimoglu and Yetimoglu [12] for the same strain rate. The highest and lowest values of angle of internal friction were 18° (corresponding to 0.4 % fiber content, 6 %/minute strain rate) and 6.5° (corresponding to 0.1 % fiber content, 1 %/minute strain rate) respectively. Further investigation is recommended to understand the nature of variation of the friction angle.

Conclusions
In the present study extensive laboratory experiments were conducted with unreinforced and discrete polypropylene fiber reinforced ML [26] soil under varying strain rates. It was observed that at higher strain rate, for unreinforced soil, due to disintegration of inter particle bond the strength reduced. But, in case of reinforced soil, addition of fiber vanquished the effect of above breakage of particle bonding; and the failure deviator stress increased with rise in strain rate. This happened due to build up of greater pore pressure in slow test. For 0.5, 3, and 6 %/minute strain rates, with increase in polymer content initially the cohesion increased then decreased. But for 1 %/minute rate of strain the value of cohesion showed a zig-zag variations. A limitation of this study was that only one length (5 mm) had been considered for reinforcing the soil. It may be mentioned here that no literature could be found reporting the behavior of polymer reinforced soil at different strain rates, and due to lack of literature the responses observed in the present investigation could not be verified. But, the present findings would serve as benchmark for future studies.
References
- Alrefeai T, Al-Suhaibani A – Dynamic and static characterization of polypropylene fiber-reinforced dune sand. Geosynthetics International 5 (5): 443- 458
- Yetimoglu T, Inanir M, Inanir OE- A study on bearing capacity of randomly distributed fiber-reinforced sand fills overlying soft clay. Geotextiles and Geomembranes 23 (2):174 – 183
- Babu GLS, Vasudevan AK, Haldar S – Numerical simulation of fiber-reinforced sand behavior. Geotextiles and Geomembranes 26 (2):181-188
- Consoli NC, Vendruscolo MA, Fonini A, Rosa FD – Fiber reinforcement effects on sand considering a wide cementation range. Geotextiles and Geomembranes 27 (3):196-203
- Shao W, Cetin B, Li Y, Li J, Li L (2014) Experimental investigation of mechanical properties of sands reinforced with discrete randomly distributed fiber. Geotechnical and Geological Engineering 32 (4): 901-910
- Choo H, Yoon B, Lee W, Lee C – Evaluation of compressibility and small strain stiffness characteristics of sand reinforced with discrete synthetic fibers. Geotextiles and Geomembranes 45 (4): 331-338
- Consoli NC, Godoy VB, Rosenbach CMC, da Silva P – Effect of sodium choloride and fiber-reinforcement on the durability of sand- coal fly ash – lime mixes subjected to freeze-thaw cycles. Geotechnical and Geological Engineering, DOI: 10.1007/s10706-018-0594-8
- Freitag DR; Soil randomly reinforced with fibers. Journal of Geotechnical and Geoenvironmental Engineering, ASCE 112 (8): 823-826
- Nataraj MS, McManis KL (1997) Strength and deformation properties of soil reinforced with fibrillated fibers. Geosynthetics International 4 (1): 65-79
- Puppala AJ, Musenda C – Effect of fiber reinforcement on strength and volume change in expansive soils. Transportation Research Record, Paper No: 00-0716, pp 134-140, 10.3141/1736-17
- Tang CS, Shi B, Gao W, Chen F, Cai Y- Strength and mechanical behavior of short polypropylene fiber reinforced and cement stabilized clayey soil. Geotextiles and Geomembranes 25 (3): 194-202
- Zaimoglu AS, Yetimoglu T – Strength behavior of fine grained soil reinforced with randomly distributed polypropylene fibers. Geotechnical and Geological Engineering 30 (1): 197-203
- Alzubaidi R, Lafta SH- Effect of strain rate on the strength characteristics of soil-lime mixture. Geotechnical and Geological Engineering 31 (4): 1317- 1327
- Sudan GK., Sachan A – Effect of strain rate on pore pressure evolution and effective stress path of soft soil under different stress history conditions. International Journal of Geotechnical Engineering 11 (1): 62-71
- Richardson AM, Whitman RV – Effect of strain rate upon undrained shear resistance of a saturated remoulded fat clay. Geotechnique 13 (4):310-324
- Zhu J, Yin J – Strain-rate dependent stress-strain behavior of overconsolidated Hong Kong marine clay. Canadian Geotechnical Journal 37 (6):1272-1282
- Abraham DRJ, Martinez-Vasquez JJ, Santamarina JC – Strain-rate effects in Mexico City soil. Journal of Geotechnical and Geoenvironmental Engineering, ASCE 135 (2): 300-305
- Enomoto T, Koseki J, Tatsuoka F, Sato T – Rate-dependent behavior of undisturbed gravelly soil. Soils and Foundations 56 (3): 547-558
- USCS Unified Soil Classification Systems for Roads, Airfields, Embankments and Foundations. U.S. Department of Defense Military Standard; MIL – STD -619 A, Washington, 25, D.C.
- Classification and identification of soils for general engineering purposes. Bureau of Indian Standards, New Delhi, India
About the author
Dr. Siddhartha Sengupta has published a number of research papers in national and international journals, and worked as the principal investigator in four sponsored research projects. He has supervised eleven postgraduate theses till date. Also, he is a member of different professional bodies such as IEI, ISTE, IGS, ISSMGE. The author graduated (Civil Engineering) from University of North Bengal in the year 1998. He completed M.E. in Civil Engineering (specialization – Soil Mechanics & Foundation Engineering) in 2000 from Birla Institute of Technology, Mesra, Ranchi. In 2005, he obtained his Ph.D. in Civil Engineering (specialization – Geotechnical Engineering) from IIT Kharagpur.